2021 Executive Summary
2021 Report to the Community
Executive Summary
This executive summary provides data and an analysis of trends across Pittsburgh Public Schools (PPS), based on data in this and previous A+ Schools reports. For some indicators, the city’s charter schools are also discussed. Our goal is to provide readers with a sense of how students, teachers, and families are faring based on a variety of factors. The system is currently designed to get the outcomes it gets. As noted in last year’s report, the data we analyzed continue to demonstrate that the system of education in Pittsburgh, like so many systems our families interact with, privileges some at the expense of the majority.
With the onset of the pandemic and the closure of schools in March of 2020, existing inequities became worse. Lack of Internet access and computers at home halted all learning at PPS for two months, while some districts in our region were able to get schools back up and running within a week. Parents were left to care for their children during the school day, or rely on friends and family if they were essential workers, with learning activities being provided by some schools.
In the fall, while other districts in the region were opening full time or in a hybrid mode, PPS (along with two other districts out of the 43 in the county) remained fully remote. While students now had greater access to their teachers (via online learning platforms), Internet connectivity and device speed exacerbated inequities as families with means could use their own devices and upgrade to faster Internet to address those issues. Those with means could also afford to have a household member stay home from work, hire childcare to support learning, or provide supplementary learning opportunities in ways that families who struggled before the pandemic could not. Learning hubs became lifelines for families of essential workers, providing in-person learning support that children needed. But these hubs were only able to serve a little over 900 PPS students out of a total of more than 20,000.
To the credit of the district and the larger community, partnerships emerged and a variety of supports were provided for many families, from food to additional devices, Internet connection, and school supplies. These efforts helped, but clearly were not enough for a vast majority of students to finish the 2020-21 school year having met grade-level expectations.
This year, there are differences both in the data indicators we are able to report and in how we report data from a year that included seven months of virtual learning and three months of in-person and hybrid learning. For example, we have not been able to report all the student achievement information we reported in the past, in part because of differences in testing timelines, and in part because we didn’t have access to the data. We will continue to track achievement information throughout the year to get a clearer picture of what our children need. Where others have analyzed course grades and other assessment data, we provide their analysis.
We also continue to mark systemic inequities and to provide information about them to help readers understand the policies and practices that lead to different outcomes among different groups of children. We hope this will motivate you to take action, whether at your school or in your community. You can use this summary as a starting point for conversations with your school board member, school leader, and other community stakeholders to help center students and families in conversations about the future development of your neighborhood. Working together, we can help schools improve year over year.
This executive summary discusses:
Unfinished learning
Student demographics, and enrollment trends
Per-pupil funding
Teacher demographics, and job satisfaction
Chronic absence (missing 10% or more of the school year), and its relationship to course failure
Suspension
“Gifted” identification
Advanced course taking, and GPA
Graduation rate
We also highlight bright spots across the district—schools and programs that are getting better outcomes by doing something in a different way.
Unfinished learning

When students graduate not ready for college or careers (see the graph to the right), it affects both the life chances of the students and the entire region. As the Allegheny Conference’s 2016 “Inflection Point” study noted: “Every graduating job seeker must have the skills he or she needs to contribute to the local economy...Automation and technology are leading to the elimination of low-skill roles”. We also need the unique voices and perspectives those individuals could contribute if they had the opportunity to reach their full potential.
What about the students currently in our schools? Though we don’t have updated information on their academic proficiency, we can project, based on prior outcomes, an approximate number of students who might need additional support to meet academic standards.
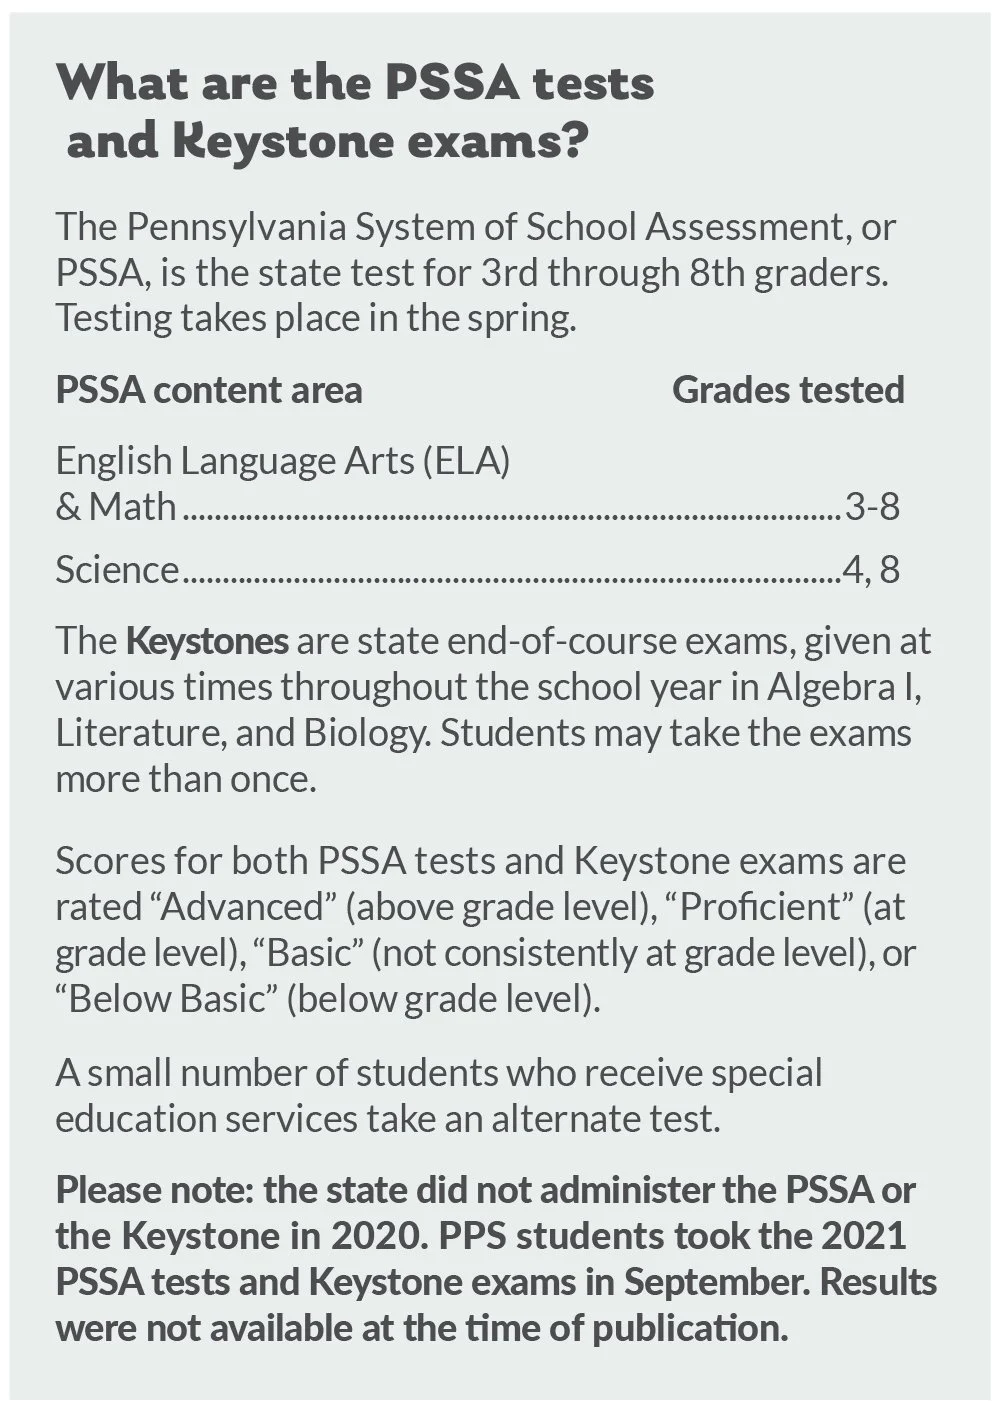
(Note: these estimates are based on state test scores—PSSA tests and Keystone exams—which test certain subject area knowledge in grades 3-8 and upon completion of Algebra, Biology, and Literature courses. Further investigation is needed to determine with greater precision the learning needs of children after the last 18 months.)
How many students need extra help in Math and Algebra?
Based on 2019 state test data, it is likely that in the 2020-21 school year approximately:
8,893 (84.32%) of Black students were below grade level
3,339 (52%) of White students were below grade level
574 (70.6%) of Hispanic students were below grade level
1,264 (68.1%) of Multi-ethnic students were below grade level
353 (47.4%) of Asian students were below grade level
Altogether, approximately 14,423 students are likely to need help getting on track to understanding math at grade level.
How many students need extra help in Reading and Literature?
Based on 2019 state test data, it is likely that in the 2020-21 school year approximately:
6,983 (66.2%) of Black students were below grade level
2,703 (42.1%) of White students were below grade level
416 (51.2%) of Hispanic students were below grade level
872 (47%) of Multi-ethnic students were below grade level
283 (38%) of Asian students were below grade level
Altogether, approximately 11,257 students are likely to need help getting on track to reading fluently at grade level.
While these numbers can feel overwhelming, they represent children in our neighborhoods and communities who need our help. Working together with our families, schools, teachers, and out-of-school time programs, we can weave a powerful safety net for students who are falling behind. Visit projectplusus.org/the-us-movement for how you can get involved.

Pittsburgh Langley PreK-8 in the West End has built deep partnerships with organizations like H.O.P.E. for Tomorrow (which runs afterschool programming at the school) and Ernst & Young (whose employees volunteer with students), among others. The school leaned on these partnerships during the pandemic to help provide needed support to children and families. You can read more about how the Langley Community School model works here.
How is your child faring?
While we were unable to gain access to the district’s NWEA MAP testing data, students across the district took these assessments in the 2020-21 school year. NWEA MAP is a test that’s given across the country. If you’re not sure how your child is doing with respect to state and national academic standards, you can request your child’s NWEA MAP test results from a teacher. All parents have a right to these data per district policy. You can use the results to start a conversation with your child’s teacher about what they’re seeing and where you can get additional support for your child’s learning, if needed.
To learn more about the NWEA MAP assessment, visit nwea.org/the-map-suite/family-toolkit.
Enrollment
We report on district demographics to understand who is being educated in our schools and changes in overall enrollment over time to provide one data point for the state of the district’s “health.”
This year, across the nation, the model districts offered during the pandemic played a critical role in which districts saw significant enrollment decline. According to the National Bureau of Economic Research, districts offering only remote instruction rather than an in-person option saw a 42% decrease in enrollment, with most of the impact in Kindergarten and elementary school grades.

As the graph on the right (Enrollment change by grade level) shows, the decline in overall PPS enrollment from 2019-20 to 2020-21 was 837 students (a 4% decline in one year), with 90% of the decline occurring in the K-5 grade span.
Over the past four years K-12 enrollment has declined 8.6% from 22,384 students in 2017-18 to 20,438 in 2020-21.
Looking more deeply at the data, we see great variability in enrollment changes across the district with Pittsburgh Schiller 6-8 growing its student population 39% since 2017 and Pittsburgh Linden PreK-5 losing 39% of its enrollment in that same time period.

Schiller 6-8 STEAM Academy (featured in our 2019 Report to the Community for its work to drastically decrease chronic absence) is a partial magnet school that has seen a huge increase in enrollment (39% growth since 2017) at a time when most schools are seeing declines.
Per-pupil funding by school
In 2016, Congress passed the Every Student Succeeds Act to update and replace key provisions of the 2001 No Child Left Behind Act. One key innovation in the law was the requirement that states needed to report per-pupil spending by school districts and schools. This past year, for the first time, Pennsylvania reported per-pupil spending by school. According to the Pennsylvania Department of Education (PDE), from 2017-18 to 2019-20, overall per-pupil spending increased in PPS by 7.8% from $25,460.09 to $27,465.08. At the school level, per-pupil spending in 2019 ranged from a low of $19,360.96 at Pittsburgh Perry High School to a high of $22,088.31 at Pittsburgh South Hills 6-8.
Other PPS schools are represented by individual dots in the chart below. A complete list of spending by school may be found online at PDE’s 2020 ESSA Report Card site.

The concentration of economically disadvantaged students did not correlate with how many resources PPS schools received in 2019, with most buildings spending between $21,000 and $22,000 per pupil, regardless of need. As PPS considers changes in the coming months to address its structural deficits, it should take into account how it can deliver greater resources to schools with higher needs in order to meet the goals of its “On Track to Equity” Plan.

The district received over $100 million as part of the American Recovery Plan passed early in 2021. Allocation of these funds will help to ameliorate some of the inequities in spending and provide resources for tutoring, student and staff mental health, and professional development (among other things).
Teaching
Teacher demographics
This year, teacher demographics for the 2020-21 school year were not available at the time of printing. As a point of reference, on the school pages we provide teacher demographics from the 2019-20 school year, the most recent data we have.
The teaching force in PPS and throughout the region continues to be overwhelmingly White. A+ Schools joined the Pennsylvania Educator Diversity Consortium because we know that a diverse educator workforce has benefits for all children. Black students who’d had just one Black teacher by third grade were 13% more likely to enroll in college than Black students who’d had no Black teachers by third grade. And, as Gloria Ladson-Billings suggests, in our increasingly segregated society, “It is important for White students to encounter Black people who are knowledgeable and hold some level of authority over them. Black students ALREADY know that Black people have a wide range of capabilities…But what opportunities do White students have to see and experience Black competence?”
We support efforts to increase the diversity of our teaching force and schools. (Click here for a discussion of the impact of segregation on student achievement).

In 2019, the Pittsburgh Federation of Teachers and the district agreed to guarantee a teaching position to graduates of the Teaching Magnet at Pittsburgh Brashear High School who finish college and get the required certifications. The first eligible cohort will be able to start in the 2023-24 school year.
Teacher job satisfaction
Each year, PPS administers a Teaching and Learning Conditions survey to all of its schools. Overall, 90% or more of teachers in 75% of PPS schools agreed with the statement that their school was a good place to work and learn in 2020-21. The schools where nearly a quarter or more of the teachers disagreed with the statement are shown on the graph below.

Chronic absence
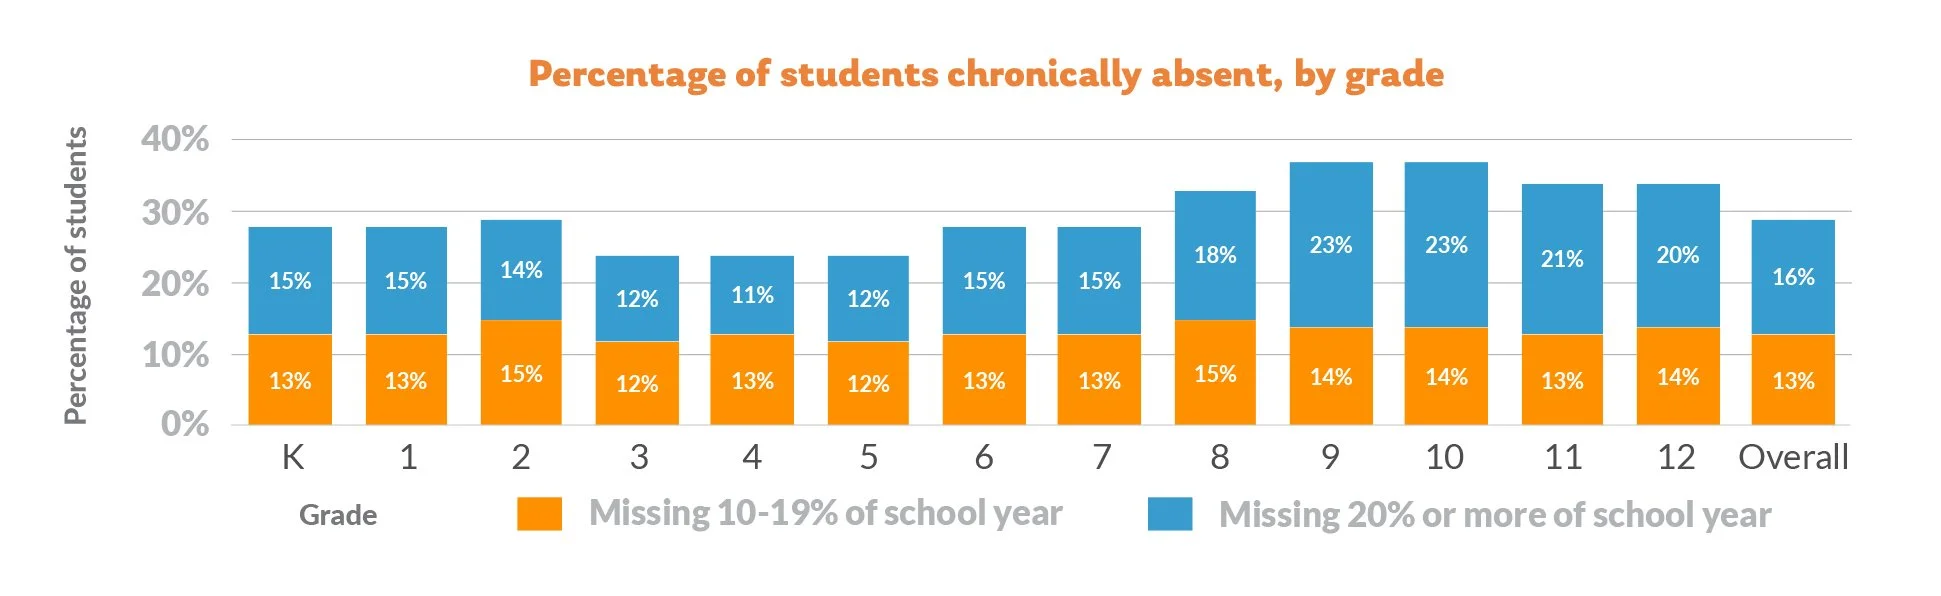
In prior years, rates of chronic absence (missing 10% or more of the school year for any reason) in PPS high schools were close to double the rates at the elementary grades. Significant shifts occurred in the past year due to the pandemic.
Overall, chronic absence increased slightly from 28% in 2019-20 to 29% in 2020-21. Rates of chronic absence decreased at the high school level from an average of 47% to 36% (a 23% decrease) but rose significantly in the elementary grades from 19% on average to 26% in 2020-21 (a 37% increase). Additionally, the number of students who missed 20% or more of the school year (36 days or more in a 180-day school year) increased from 10% in 2019-20 to 16% in 2020-21 (a 60% increase compared to the prior year).
Chronic absence and course failure
Research by the Mid-Atlantic Regional Educational Lab at Mathematica found a clear relationship between absences and course failure in the 2020-21 school year (see below).

Chronic absenteeism, which can have a long-term effect on students, is a complex problem involving both families and schools. According to the American Institutes for Research and Attendance Works, “certain conditions for learning open the school door for students, literally and figuratively, helping pull in and engage students and families.” These conditions include:
Physical and emotional health and safety
Students’ sense of belonging, connection, and support
Academic challenge and engagement
Adult and student social and emotional competence
To learn more about the conditions, and how your school can leverage chronic absence data to create plans that engage students and families, contact A+ Schools.

The District’s Data Research, Evaluation, and Assessment team has built out a strong set of data dashboards (pghschools.org/dashboards). The “Attendance Rates” dashboard provides up-to-date information about chronic absence and student attendance by school. For community organizations looking to support improvements at a school, knowing the current level of chronic absence can be an invaluable tool in doing root cause analysis with staff and families to help overcome barriers to school attendance.
Suspension
Due to remote learning, suspensions in PPS fell dramatically to 46 suspensions total over the school year. Given that there were so few suspensions, we do not report suspension data on the PPS school pages. We do report suspension data for charter schools, which offered in-person instruction for longer portions of the year. Charters also saw a pronounced decrease in suspensions.
A pattern of disproportionality persisted in PPS with 34 out of the 46 students suspended being Black. Forty-three out of the 46 were economically disadvantaged, and 17 out of the 46 had individual education plans (IEPs) for special education, excluding “gifted” students.
Gifted identification
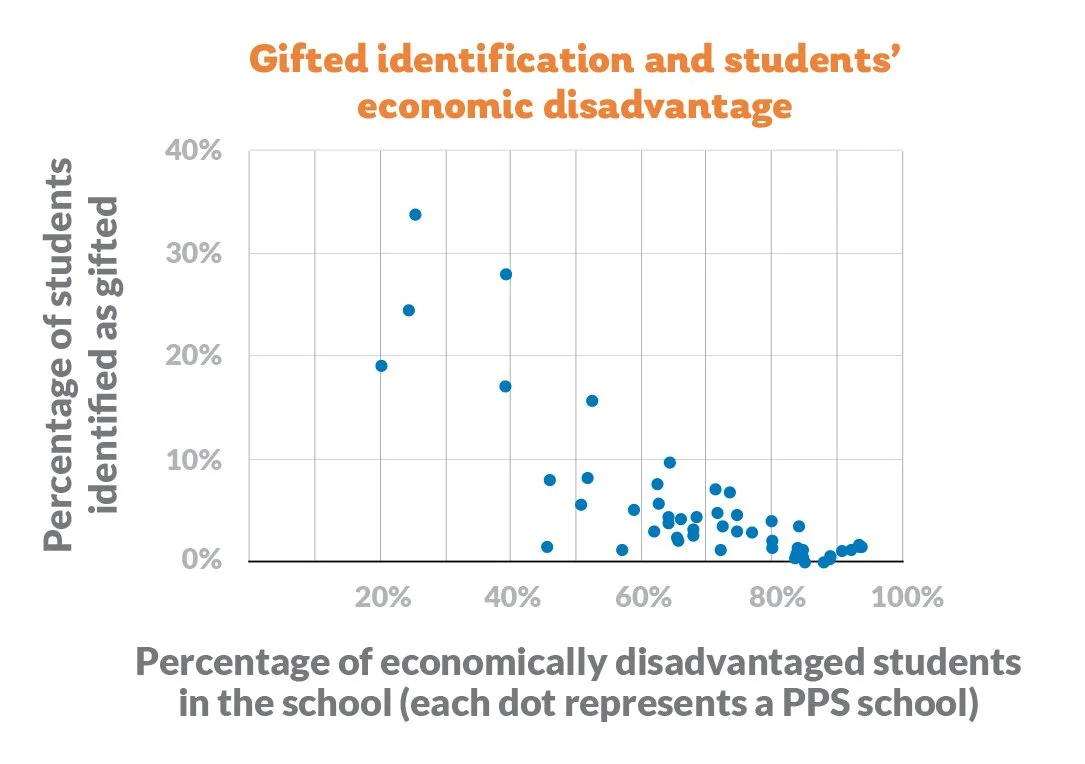
As in previous years, how many students were identified as “gifted” in a school was strongly correlated with the percentage of economically disadvantaged students in the school.
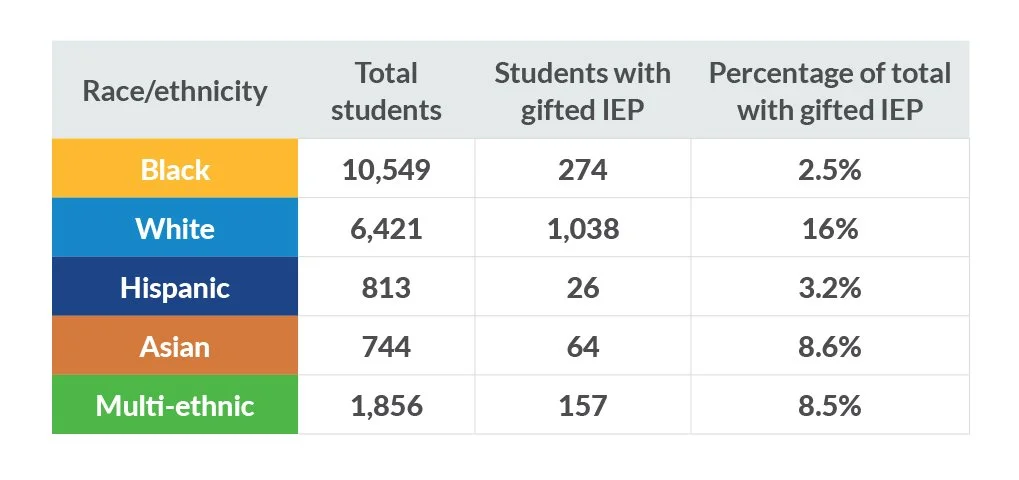
Additionally, racial disparities in gifted identification persist in PPS. White students were 6.4 times more likely to have a gifted IEP than Black students, 5 times more likely than Hispanic students, and nearly 3.5 times more likely than Asian and Multi-ethnic students. Students with gifted IEPs are automatically enrolled in Advanced Placement (AP) and Centers for Advanced Study (CAS) high school courses. Students not identified as gifted must receive a recommendation from a teacher and apply for the course.
Advanced placement
AP course taking

We track student enrollment and success in AP courses year over year to understand the level of access students have to these more rigorous courses based on race. Overall, there was a small increase in the number of students taking AP courses since the 2019-20 school year, with a 5% increase in the number of Black students enrolled in AP courses in 2021, and a 4.5% increase in the number of White students taking AP courses in 2021. Asian and Multi-ethnic student enrollment in AP decreased slightly, while Hispanic student enrollment increased. While the overall increase in enrollment is encouraging, Black students are still under-enrolled in these courses by a significant amount based on overall enrollment numbers. This opportunity gap in AP course taking has an impact on both graduation rates and college persistence, according to research.
AP students eligible for college credit
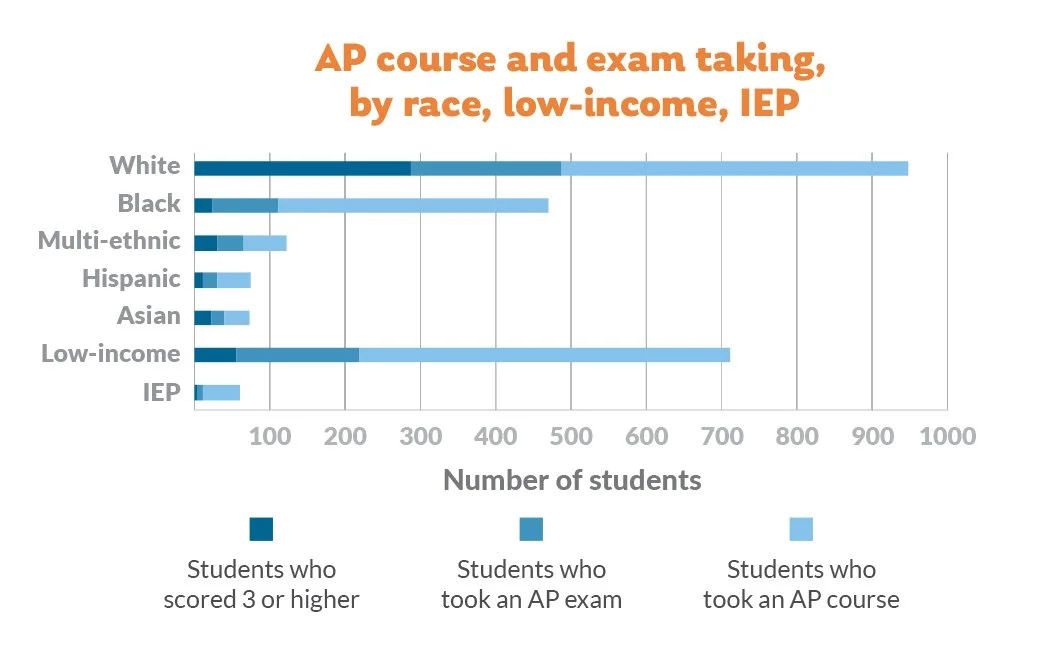
On the graph to the left (AP course and exam taking, by race, low-income, IEP), you can see the total number of students, disaggregated by race, who took an AP course, took an AP exam, and scored 3 or higher, making them eligible for credits at many colleges. Notably, three-fourths of Black students who took an AP course did not sit for the exam. White and Asian students scored 3 or higher at much higher rates than Black and Hispanic students.

Nearly 70% of Westinghouse 6-12 students who took an AP course took the exam (34 out of 49 students). Black students at Westinghouse took the exam at more than twice the rate of Black students in the district who took the exam last year.
Grade Point Average that meets college readiness standard
PPS, like many districts across the country, has adopted the “Redefining Ready!” indicators from AASA (the School Superintendents Association). According to research they’ve compiled (redefiningready.org/research-collegeready), a grade point average (GPA) of 2.8 or above is one of multiple indicators that can predict success in college. The graph to the left shows seniors who had a GPA of 2.8 or above by school, including charter schools. For PPS schools, we also looked at the number of seniors with a 2.8 GPA or higher by race, which shows significant differences. Out of 1,268 seniors in 2020-21, 551 seniors did not have a 2.8 GPA.


Graduation rate

Overall, rates of graduation in 2020, the most recent year available, were down 2 percentage points from 2019, 80% to 78%, with the largest one-year decline occurring for Hispanic students. The 22% that did not graduate represents 381 students, the majority of whom are students of color.
Conclusion
We began this executive summary with a look at the potential need for additional student supports to get all students on track to meeting grade level standards, graduation, and post-secondary education success. In the past year, we launched Project +Us as a way to address the inequities we see and to rally the community to remove community-based barriers to student success. It’s an all-in approach that recognizes that improving schools requires us to improve a broad range of community supports for children and families. We hope you will join us in this effort. Click here to sign up to learn more about what’s happening in your neighborhood or community.
Together, we can support all children to succeed in school.
Methodology
The executive summary analysis was conducted using data in the full report and previous reports as well as additional public data from PDE and from PPS. Click here for a list of definitions and sources of information.
The executive summary findings were developed by Sean Caulfield, data analyst for the report, and data interns Alec Harkins and Sam Dzunski from CMU Heinz College.